iAstroPhoto v. 1.2.1
Focus Module
Focus Metrics
(click on the thumbnails to see larger images)
iAstroPhoto measures the focus of an image by
In the analysis of each cross section, two focus metrics are computed:
The focus analysis can measure the sharpness of points or of edges. When measuring the sharpness of points, the focus object should be sharply peaked, like a star image. When measuring the sharpness of edges, the edge should be high contrast, with approximately constant brightness on either side of the edge. This type of edge will show a sharp peak in the slope values. When in the Star analysis mode, a Gaussian curve will be fitted to the brightness data. When in the Edge analysis mode, the curve will be fit to the slope data.
iAstroPhoto measures the focus of an image using two types of metrics:
The Focus Score is defined as the square root of the sum of the squares of the focus quality and maximum slope for the x and y cross sections. In other words the score is the length of the vector whose components are the individual focus metrics.
Maximum luminance, or brightness, can also be considered a focus metric because a more focused star image will have more of its light concentrated at a pixel. But I do not use maximum brightness in the focus score because it is less sensitive than the other metrics, and is more appropriately used to monitor the overall brightness of the image. Luminance is also not appropriate for edge focus analysis.
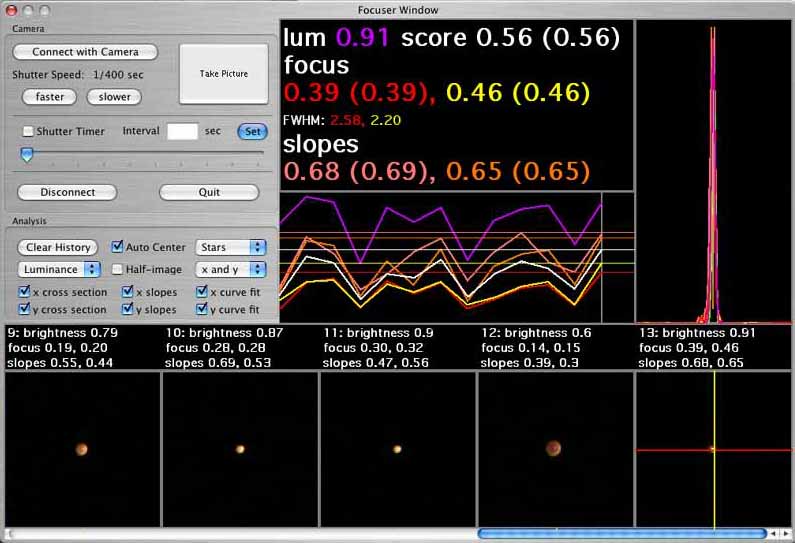
These metrics are displayed in the focus metrics section of the focus window:
After each focus metric the best value for that metric in the current history is shown in parenthesis.
The FWHM is also shown for those who prefer that metric.
Just below the text report area is a focus metric history graph, which shows the various focus metrics over time. The colors are the same as in the text region. The horizontal lines indicate best values for each metric.
The Gaussian curve fit can be observed in the graph window. To verify that the curve fit is good for a particular extract, you should compare it with the data being fitted by turning off the graph of all the other data.